Learn Ejerblik · Lesson 2 of 5
The owner-managerThe dashboard
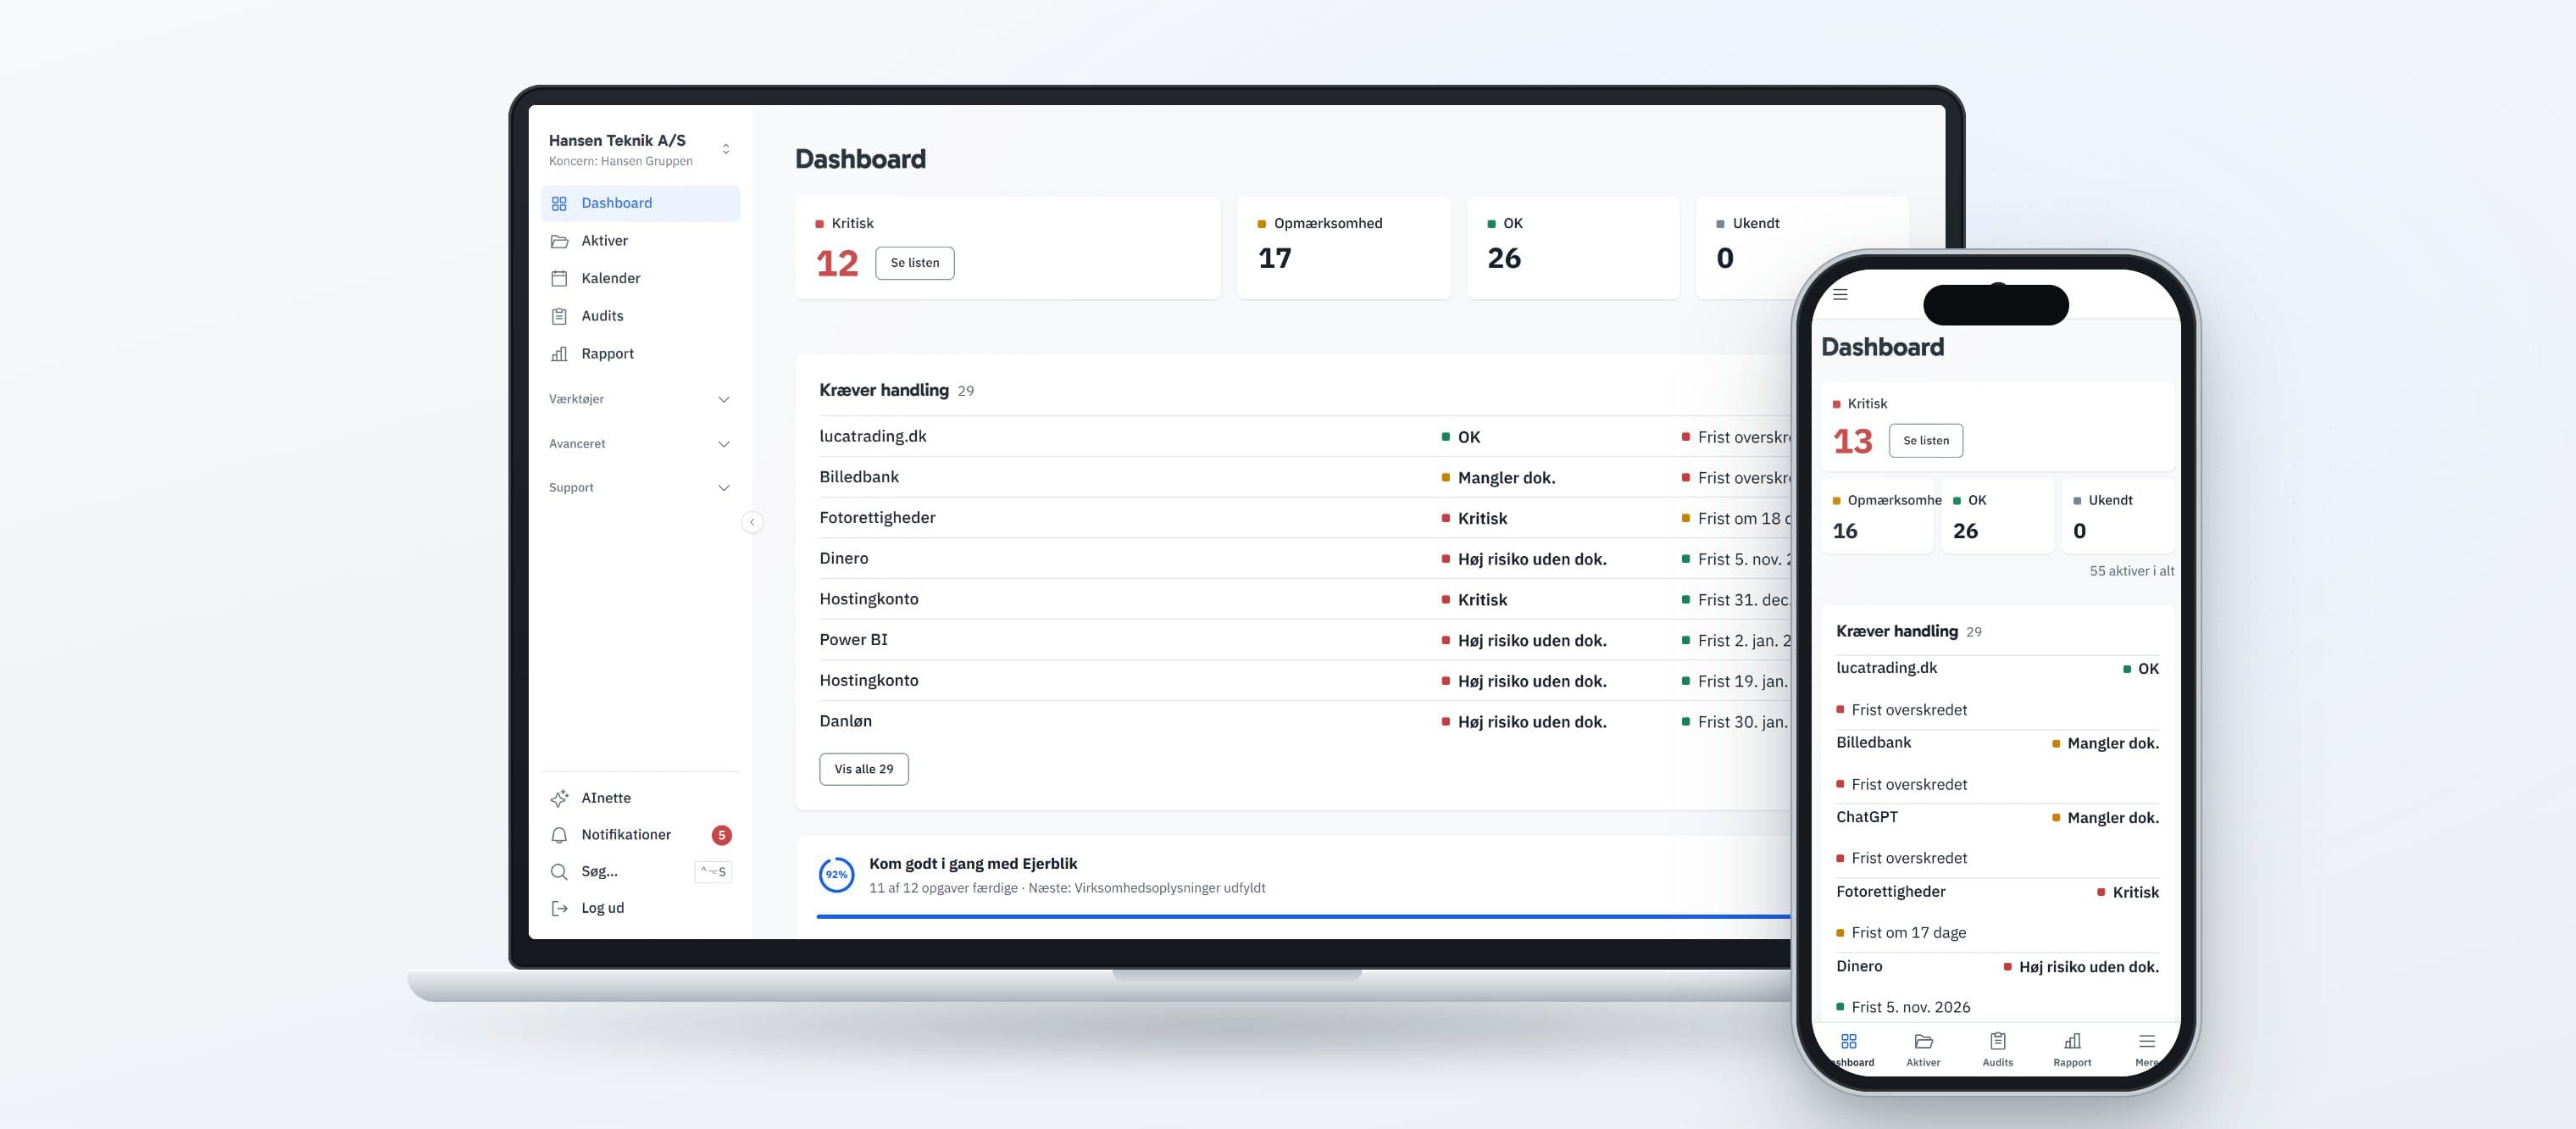
The dashboard is the first thing you see after logging in. At the top is how your assets are doing right now, then what requires action, three charts and finally your widgets.
Who sees the dashboard?
The dashboard is available on every plan and is seen by every role except Guest. It stays empty until you have registered your first asset.
The four figures at the top
Under the heading Dashboard you see the total number of assets and four figures: Critical, Attention, OK and Unknown. Each asset is counted once, at its worst level, so the four figures add up to the total. "See the list" opens the assets behind a figure.
Critical is an asset with the status Critical, an asset at High risk with the status "Missing documentation", or an asset whose notice deadline has passed. Attention is a deadline within 30 days, the status "Missing documentation" or the status "Vendor-dependent".
Unknown is an asset without a status, or a running agreement without a renewal date. OK is everything else.
Requires action
The list shows the assets at Critical and Attention, critical ones first and then by nearest deadline. Click an asset to open it, or "Show all" to see the whole list.
Banners
Below the figures there may be a banner, for example asking you to confirm your email address or switch on two-factor authentication. Until your email address is confirmed, you can neither invite colleagues nor share the report outside the company.
The three charts
Status by department shows the breakdown in each department, with the departments that have the most critical assets at the top. An asset in several departments is counted in each of them. Renewals in the next 12 months shows when agreements run; it is based on the renewal date, not the notice deadline.
Risk distribution shows how many assets are Low, Medium and High. Risk describes how important and exposed an asset is, not its condition, so it has no status colour.
Your widgets
At the bottom is "Your widgets". By default these are Action points from your audits, Recent assets, DD readiness score, This week, Expiring access and Priority helper.
On the Professional plan you can tailor the page with "Edit layout" and "Add widget", create several dashboards and go back with "Reset to default". On the other plans you see the standard version.